CQG TFlow® Charts
Unique Market Insight
The Ultimate Data Visualization Tool
CQG's TFlow charts and studies give traders an exclusive way to see the inside market, showing whether traders are hitting bids or lifting offers to generate the last price. With TFlow charts' color coding, you know who the aggressors are: the buyers or the sellers.
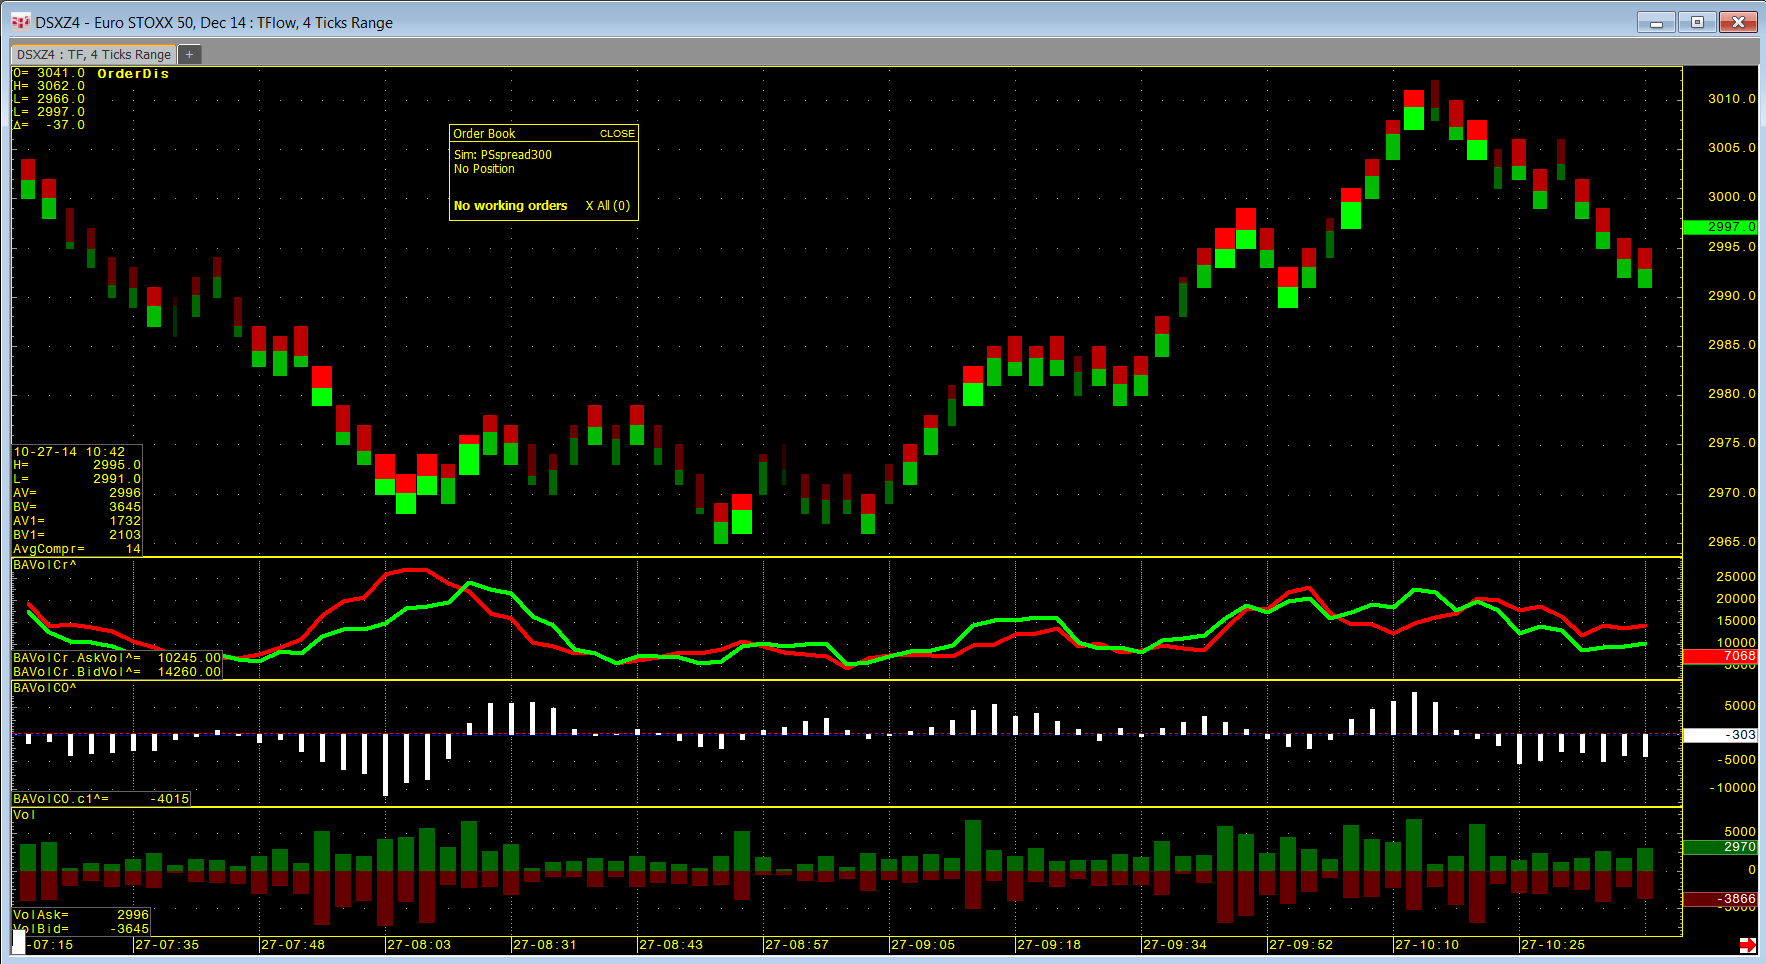
Aggregated TFlow
Identify Support and Resistance
Aggregated TFlow bars provide the same information as one-tick TFlow bars, but they are compressed into a single bar based on a number of bars. You can compress up to twenty bars. Bar aggregation is used to highlight support and resistance levels.
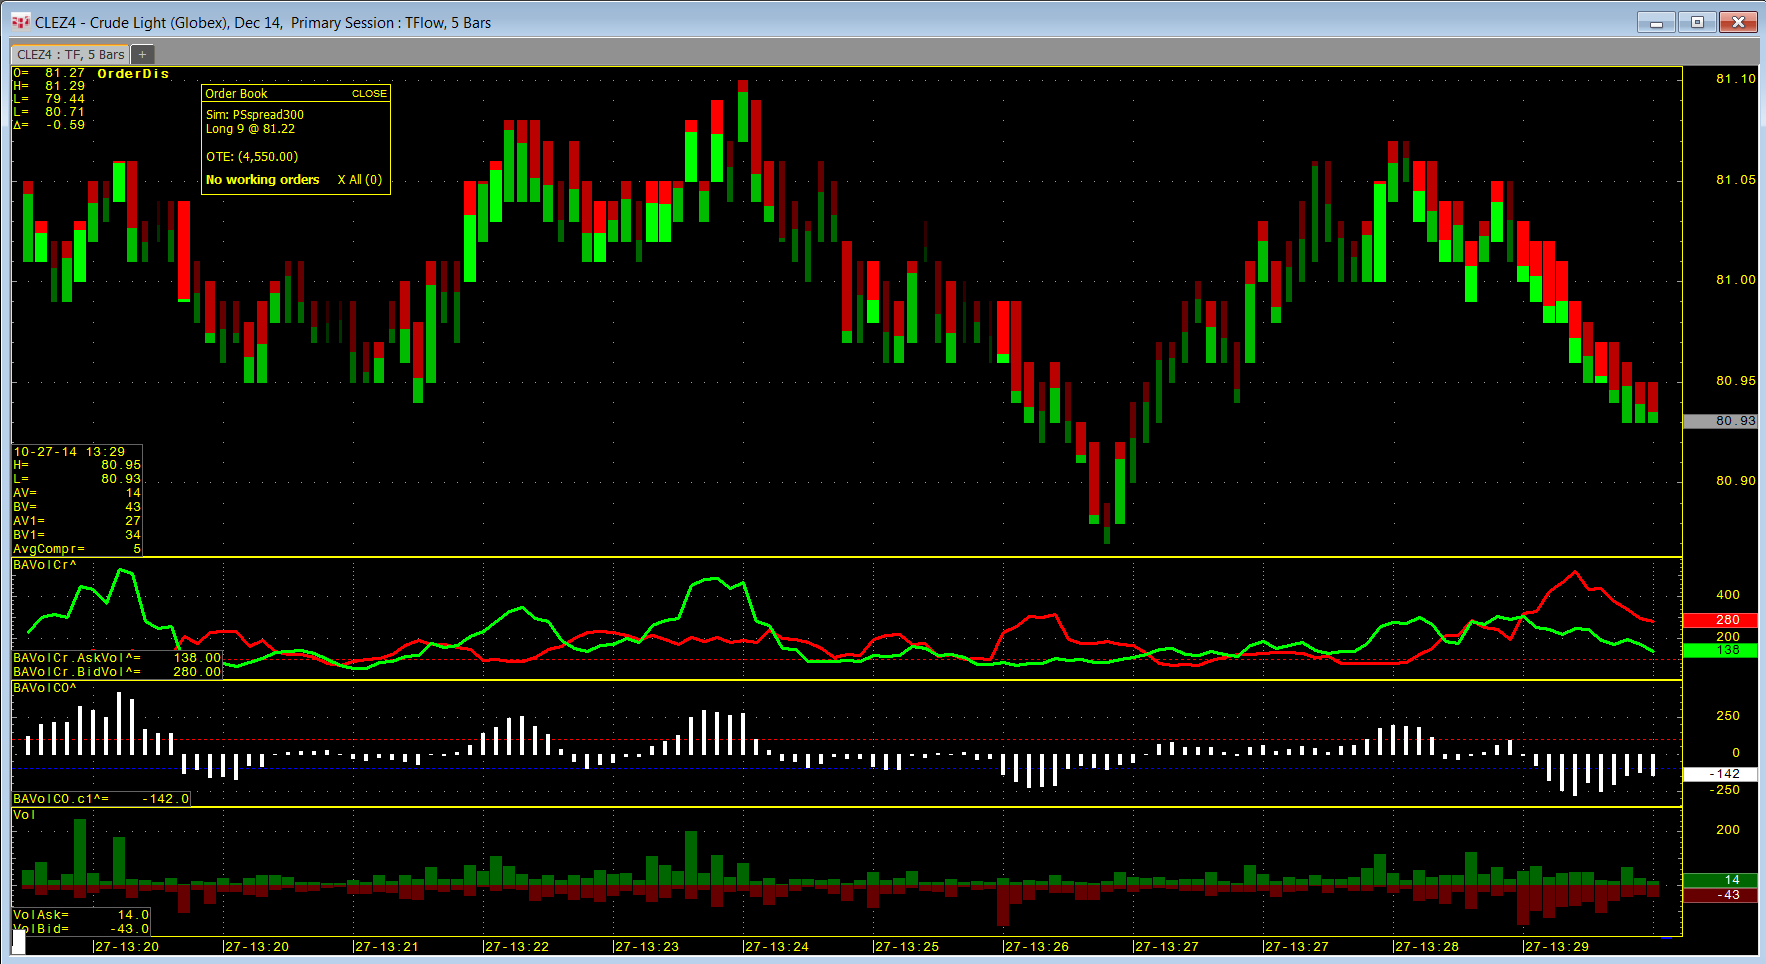
Range-Aggregated TFlow
Save Screen Real Estate
Range TFlow bars are built based on the specified price range for each TFlow bar. You can use a price range of up to twenty ticks for each TFlow bar. Range aggregation compresses market action, making better use of screen real estate.
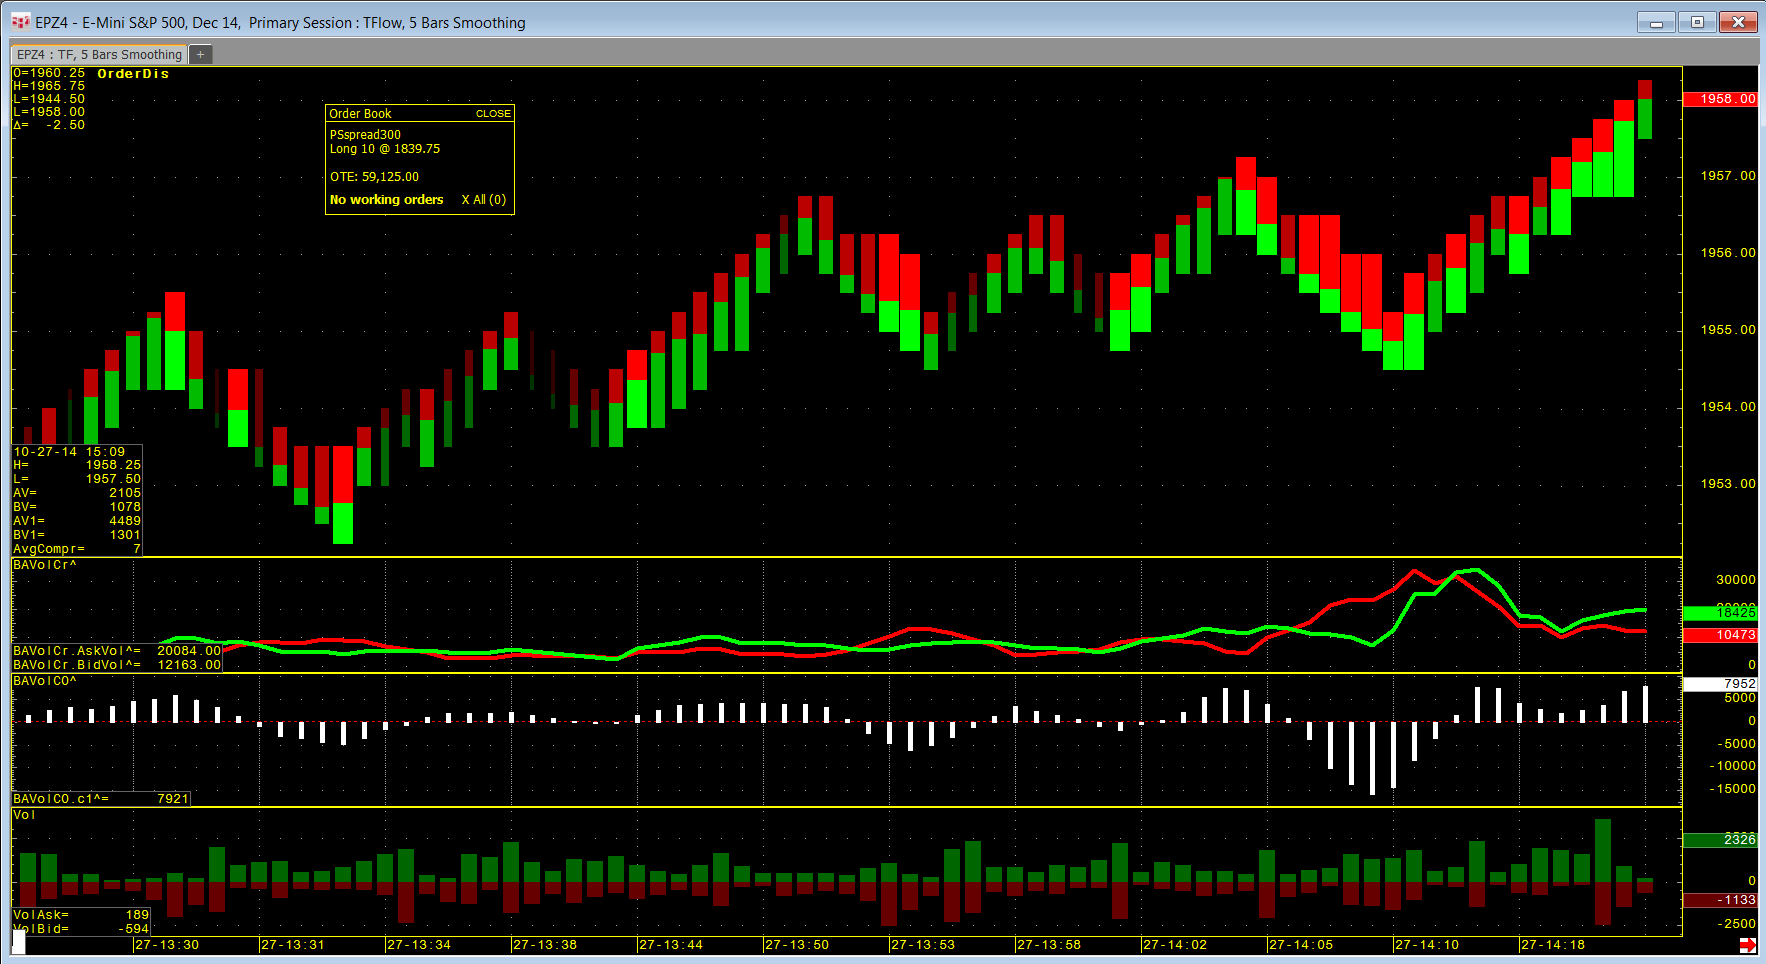
Smoothed TFlow
Spot the Trend
Smoothed TFlow bars use a proprietary algorithm to reduce market noise around the trend. This smoothing technique helps to both identify the trend and to spot key market turns. The same color coding used with standard TFlow bars is used to indicate if the buyers or the sellers are the aggressors.
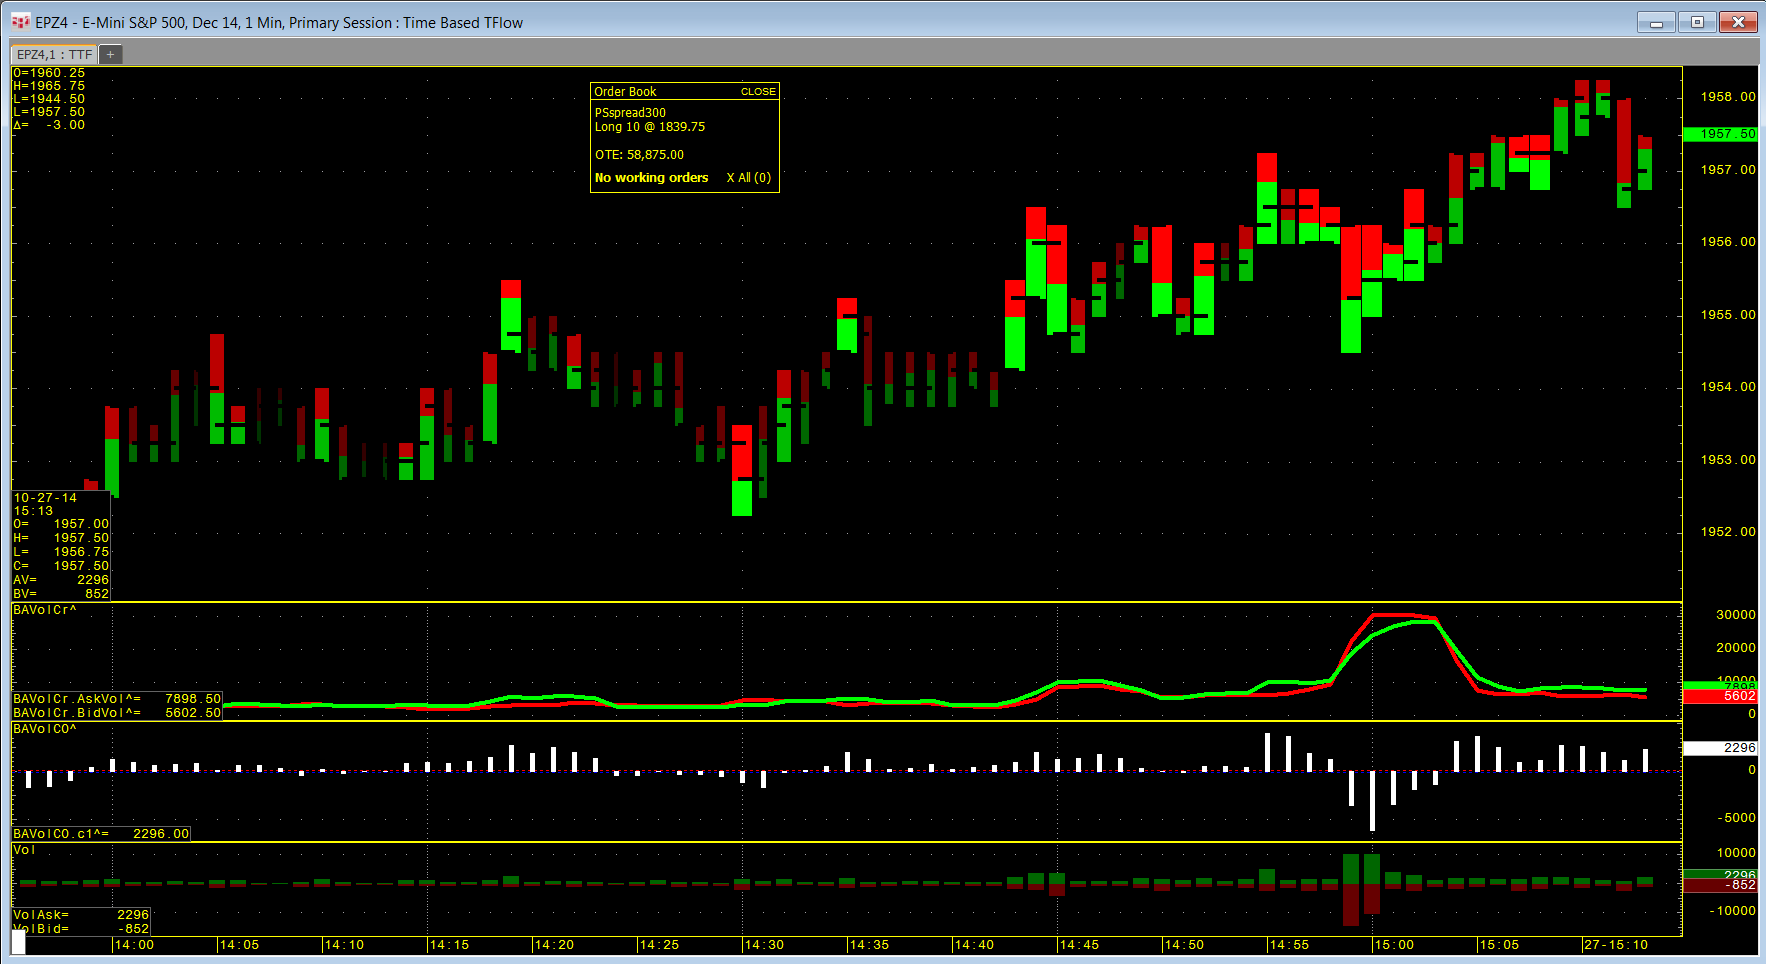
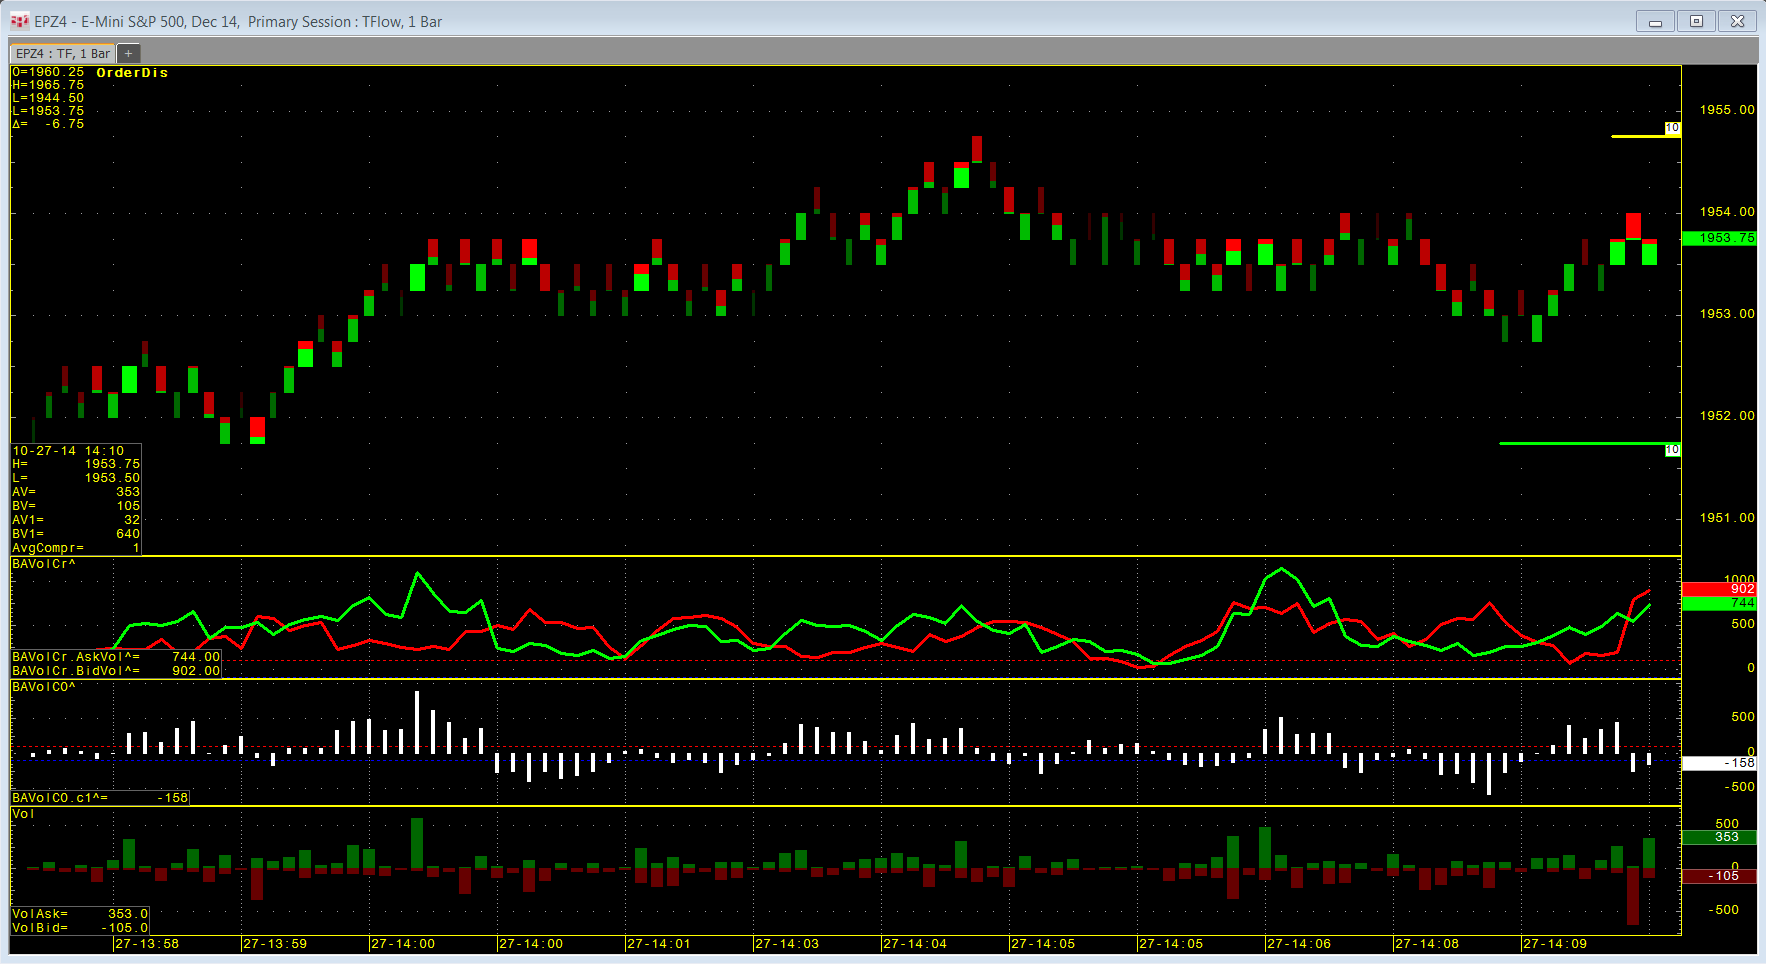
Time-Based TFlow
Visualize Trade Volume
Time-Based TFlow charts display bars built based on Time & Sales data similar to regular time bars, but with the addition of bid and ask volume. Time-based bars appear as TFlow bars with open and close markers. The color brightness and width of the bars are based on the level of volume relative to recent volume history.